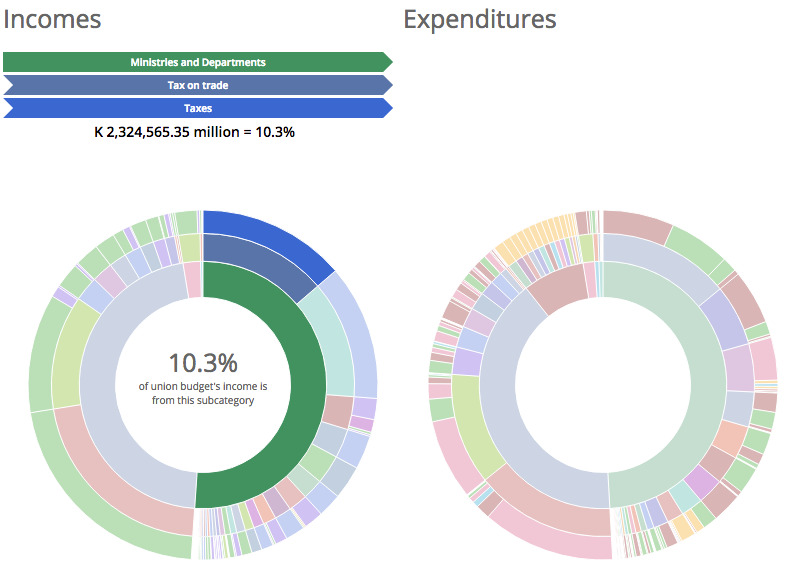
Lately, I've become really fascinated by sunburst diagrams and was looking for datasets that I could use to visualise in that format.
Turns out the Open Myanmar Initiative has collected pretty detailed data on Myanmar's government budget going back till 2012. They have a whole budget explorer site with all sorts of interactive graphs that you should go check out.
So I made a visualisation. You can look at the full screen version here.
The viz shows how Myanmar's government budget, split into incomes and expenditures, has been apportioned on three different levels. The innermost circle divides the budget into broad categories of organisations, such as ministries, state economic enterprises (SEEs), and the central bank. The second circle gets into more details, such as individual ministries and departments. The outermost circle shows the individual budget entries, such as tax revenues, or capital expenditures, etc.
The great thing about the sunburst visualisation is how it allows you to see how all individual little categories and budget items fit into the big picture.
After a few seconds of playing around with the viz it you can start identifying some trends, such as the prominence of State Economic Enterprises in the government budget, or how revenue from the state enterprises in the energy sector exceed income and property tax revenues.
Trends in the Budget
Because the sunburst visualisation shows everything proportionally as sectors on a circle which always add up to 360 degrees, you can't really tell at a glance if, in any given year, the total incomes are higher or lower than the total expenditures. It's also hard to see how the figures change across the years.
So here's a column chart that shows the yearly incomes and expenditures. Values shown are in millions of kyats.
Column chart showing yearly incomes and expenditures
Here's the same column chart but with incomes and expenditures stacked into categories.
Stacked column chart showing yearly breakdown of income and expenditure categories
You can see clearly from the chart that the total expenditures of the ministries and departments exceed incomes in each year. This is only natural, since the government has to provide a lot of services and the tax base of the country is not yet well developed. However, you might think that the state economic enterprises, which enjoy cushy monopolies in a lot industries, should be turning a profit. Not quite. It looks like except for the year 2013, expenditures for SEEs exceeded incomes.
Let's take a closer look at the SEEs under each ministry. Here are the ones for which we have at least 3 years worth of data, arranged from the ministry with largest budget to the smallest.
SEEs Under Ministry of Energy
SEEs Under Ministry of Electrical Power
SEEs Under Ministry of Finance and Revenue
SEEs Under Ministry of Communication and IT
SEEs Under Ministry of Industry
SEEs Under Ministry of Mines
SEEs Under Ministry of Environmental Conservation and Forestry
SEEs Under Ministry of Rail Transportation
SEEs Under Ministry of Construction
SEEs Under Ministry of Transportation
SEEs Under Ministry of Agriculture and Irrigation
SEEs Under Ministry of Information
So it looks like the two ministries whose enterprises are consistently profitable are Energy and Mines. Unsurprisingly. #ResourceCurse.
Whereas, a couple of the ministries's enterprises show losses every year, namely Electric Power, Finance and Revenue, Industry, Rail, and Information. Now, I'm sure for some of these ministries, the state economic enterprises rightly have to sell their goods and services to the public at subsidised rates, which I guess could be a good thing.
But then again, do we really want to squander the money we make from taxes and natural resources on obsolete government run factories producing shoddy products that no one wants to buy? Or government run banks that are lagging way behind those in the private sector?
According to this data, the annual government budget deficit is around 4 to 5 trillion kyats (US$ 3 to 4 billion). We hardly have any welfare programs. Healthcare spending, for instance, is about 10,000 kyats (US$8) per citizen per year. So these deficits are clearly not happening because the government is spending too generously on its citizens.
I'd love to take a deeper dive into public policy issues around state economic enterprises but this post is getting too long and I'll leave that for another post. Meanwhile, you can go read economist Lex Rieffel's research on the same issue.
Technical Stuff
Kerry Roden has a great talk on her implementation of a sunburst diagram for visualising traffic data to Youtube and how it became such a huge hit that people working in Youtube were even printing t-shirts with the viz on them.
The D3.js code for the sunburst visualisation was based on Kerry's block. The other charts were made using C3.js.
